

TYPES OF VOLATILITY INDICATOR IN TRADING
Learn what volatility indicators are and how they help traders measure market fluctuations, manage risk, and identify the best times to enter or exit trades
VOLATILITY INDICATOR
Dollarpip
3 min read
Volatility indicators are technical analysis tools used by traders and investors to measure how much the price of an asset fluctuates over a certain period. In simple terms, volatility reflects the level of market activity and uncertainty — when prices move rapidly up and down, volatility is high; when prices stay relatively stable, volatility is low.
Understanding volatility helps traders manage risk, identify potential breakout zones, and decide the right timing to enter or exit trades. Here are some of the most popular types of volatility indicators used in financial markets
1. Bollinger Bands
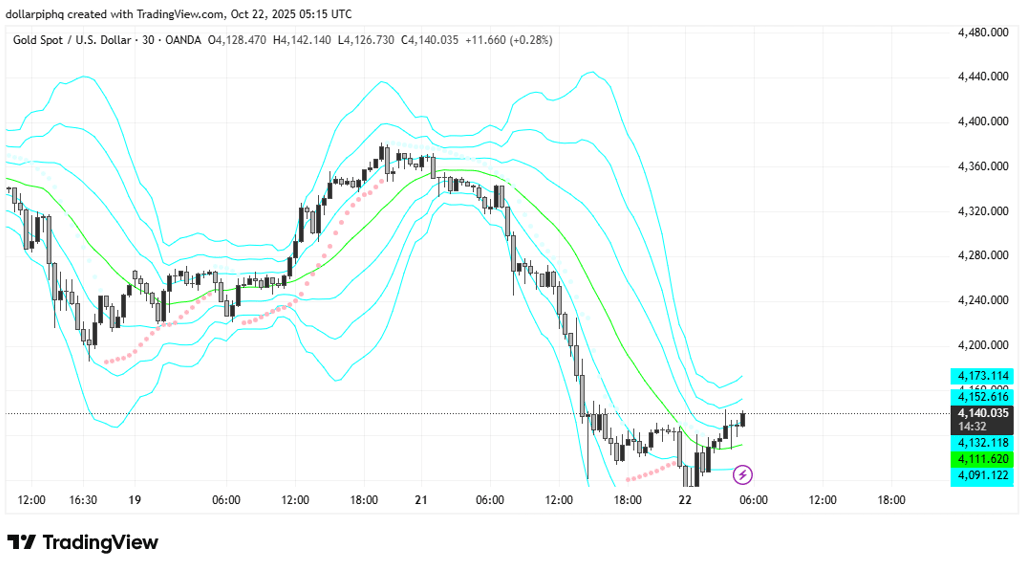
Bollinger Bands are one of the most well-known volatility indicators. They consist of three lines — a middle band (usually a simple moving average) and two outer bands plotted a certain number of standard deviations away from the middle.
When the bands widen, volatility increases; when they contract, volatility decreases. Traders often use band squeezes as a signal that a breakout may be coming soon.
2. Average True Range (ATR)
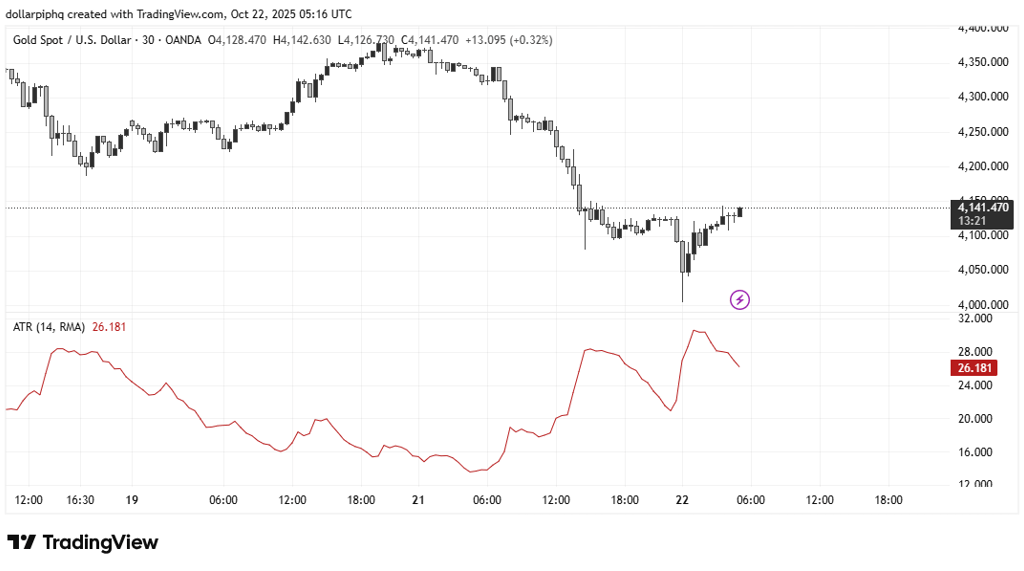
The Average True Range measures the average range between high and low prices over a specific period. It doesn’t indicate the direction of price movement but shows how much the price typically moves.
Higher ATR values indicate greater volatility, while lower values suggest calmer market conditions. ATR is widely used in setting stop-loss levels and position sizing
3. Volatility Index (VIX)
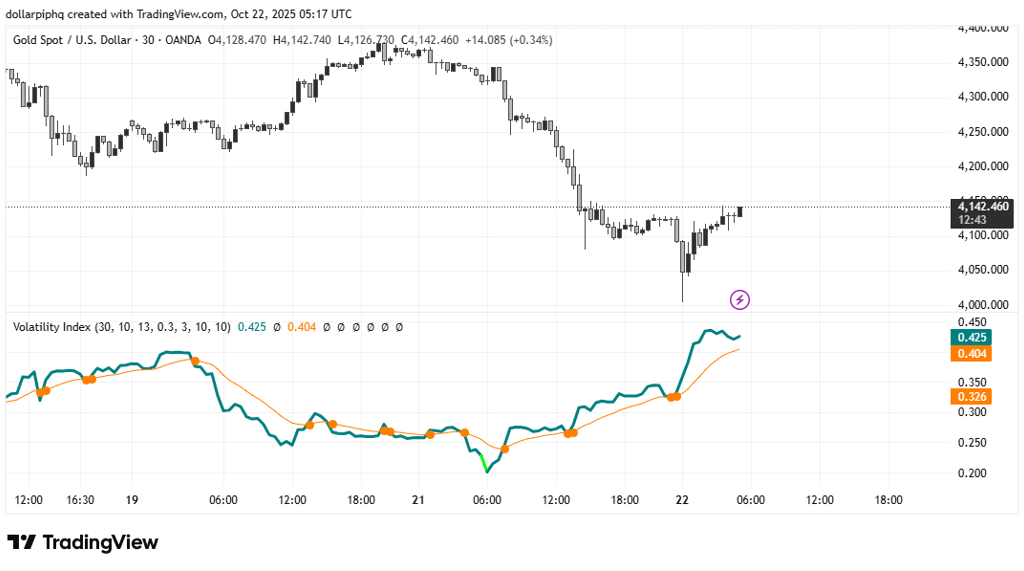
Often called the “fear gauge,” the VIX measures the market’s expectation of future volatility based on options pricing, particularly in the S&P 500.
When the VIX rises, it indicates increased market fear or uncertainty; when it falls, it shows investor confidence and stability. Although it’s primarily used for stock markets, it serves as a barometer for overall market sentiment.
4. Donchian Channels
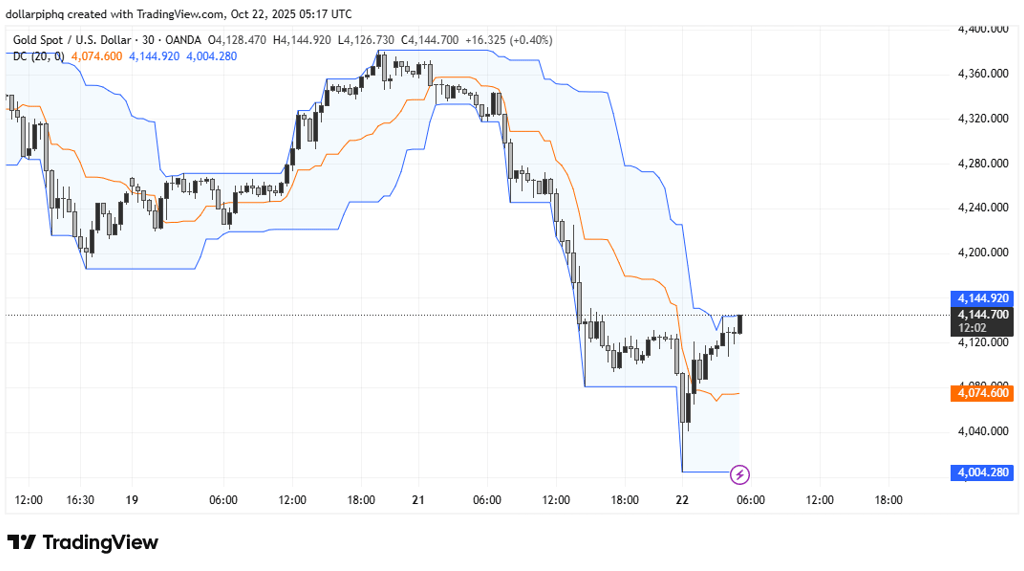
Developed by Richard Donchian, this indicator plots the highest high and lowest low over a specific period, creating a channel around price movement.
Wider channels suggest high volatility, while narrower ones indicate consolidation. Donchian Channels are also popular in trend-following systems to detect breakouts.
5. Keltner Channels
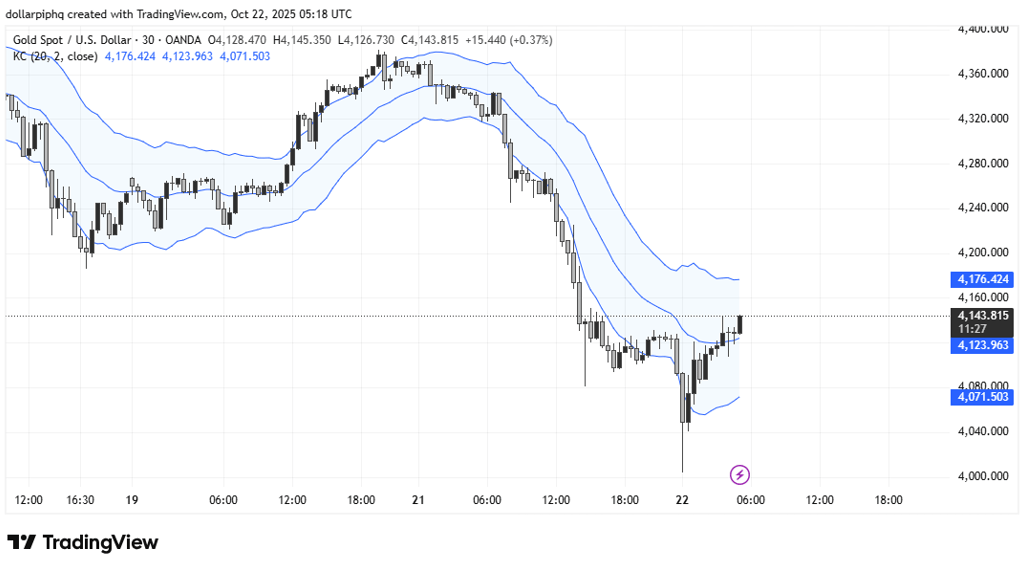
Keltner Channels are similar to Bollinger Bands but use the Average True Range (ATR) instead of standard deviation to determine channel width.
They adjust more smoothly to price movement, providing a balanced view of volatility and trend direction. Traders often look for price movements outside the channel as potential trend signals.
6. Chaikin Volatility Indicator
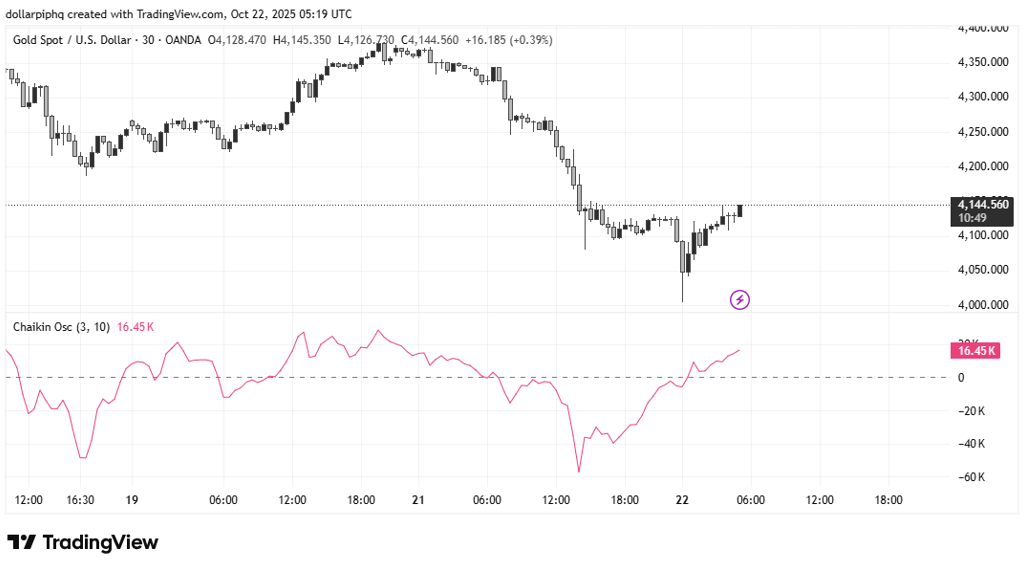
Developed by Marc Chaikin, this indicator measures the difference between the high and low prices of a market over time. It helps identify changes in volatility that could precede trend reversals.
A rising Chaikin Volatility suggests increasing volatility (potential breakouts), while a falling reading indicates declining volatility (possible consolidation)
Volatility indicators are crucial tools for understanding market behavior. They don’t predict direction but reveal the intensity of price movement — which helps traders adapt their strategies, set stop losses, and manage expectations.
Whether you’re trading forex, stocks, or commodities, monitoring volatility gives you the confidence to handle both calm and chaotic markets more effectively.