

TYPES OF TREND INDICATOR IN TRADING
Discover the types of trend indicators used in trading and learn how they guide traders in spotting bullish, bearish, or ranging markets
TREND INDICATOR
Dollarpip
2 min read

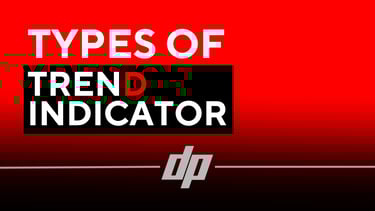
1. Moving Averages (MA)
The Moving Average is one of the simplest and most widely used trend indicators. It smooths out price data over a set period to reveal the overall direction of the trend.
Simple Moving Average (SMA): Calculates the average closing price over a specific period.
Exponential Moving Average (EMA): Reacts faster to price changes by giving more weight to recent data.
When price moves above the MA, it often signals an uptrend. When it’s below, it may indicate a downtrend
In trading, a trend indicator is a technical tool used to identify the direction and strength of a market trend. It helps traders determine whether the market is bullish (going up), bearish (going down), or ranging (sideways).
Using trend indicators allows traders to make more informed decisions instead of guessing market direction. Let’s explore the most popular types of trend indicators used by professionals worldwide
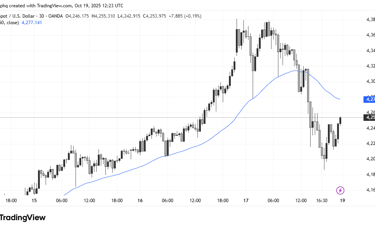
2. Moving Average Convergence Divergence (MACD)
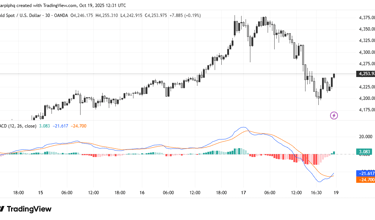
The MACD shows the relationship between two moving averages to detect trend momentum.
It’s useful for spotting potential trend reversals or continuations.
When the MACD line crosses above the signal line → potential buy signal.
When it crosses below → potential sell signal.
MACD also helps traders identify market momentum, which is key for timing entries and exits.
3. Average Directional Index (ADX)
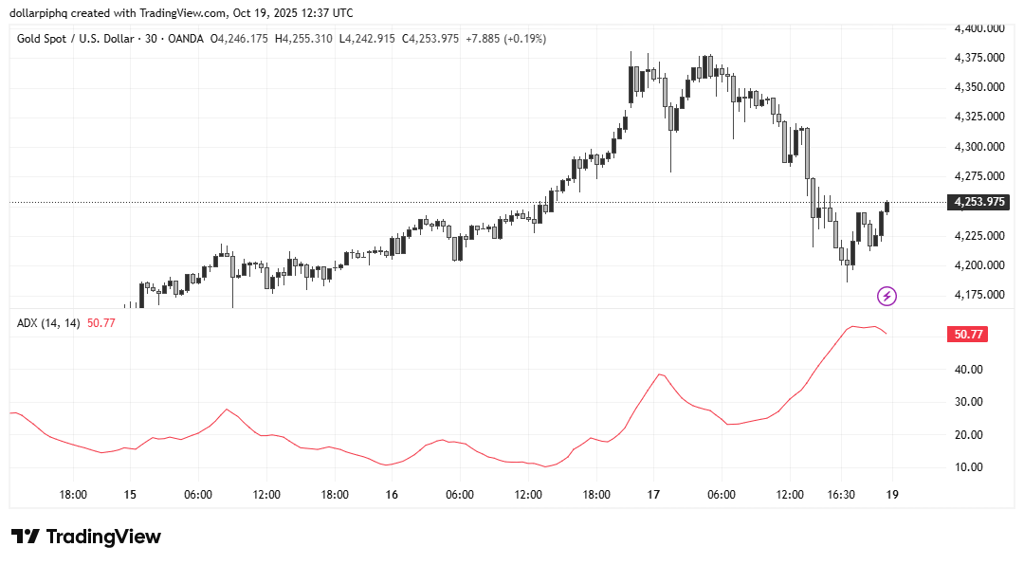
The ADX measures trend strength rather than direction.
A value above 25 indicates a strong trend (up or down).
A value below 20 shows a weak or sideways market.
Traders often use ADX to confirm whether a trend is strong enough to justify a trade.
4. Parabolic SAR (Stop and Reverse)
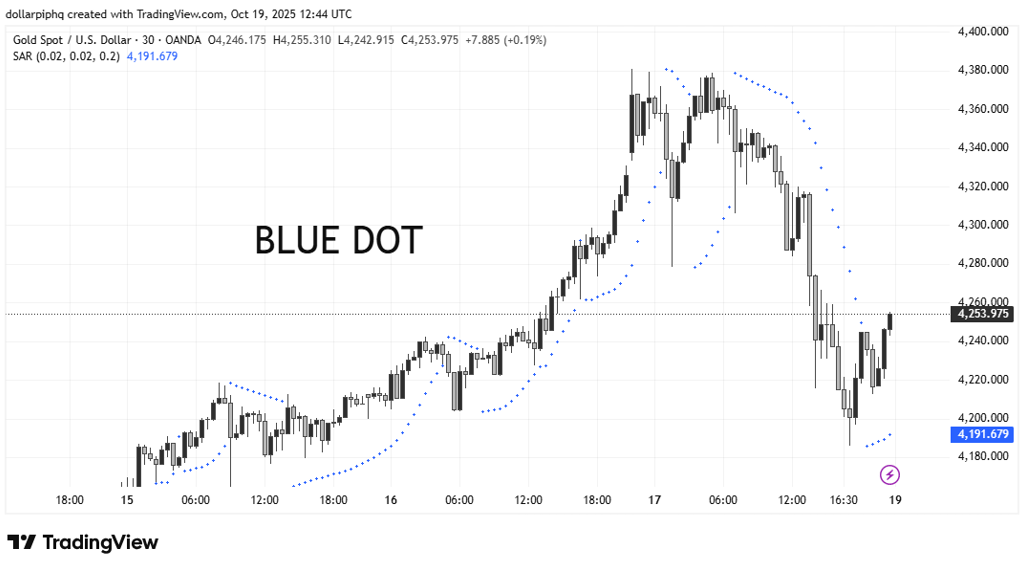
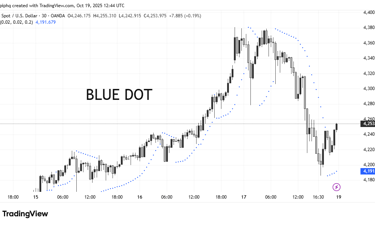
The Parabolic SAR uses a series of dots above or below price candles to signal buy or sell opportunities.
Dots below the price = uptrend / buy signal
Dots above the price = downtrend / sell signal
It works best in trending markets and helps traders set trailing stop-loss levels.
5. Ichimoku Cloud
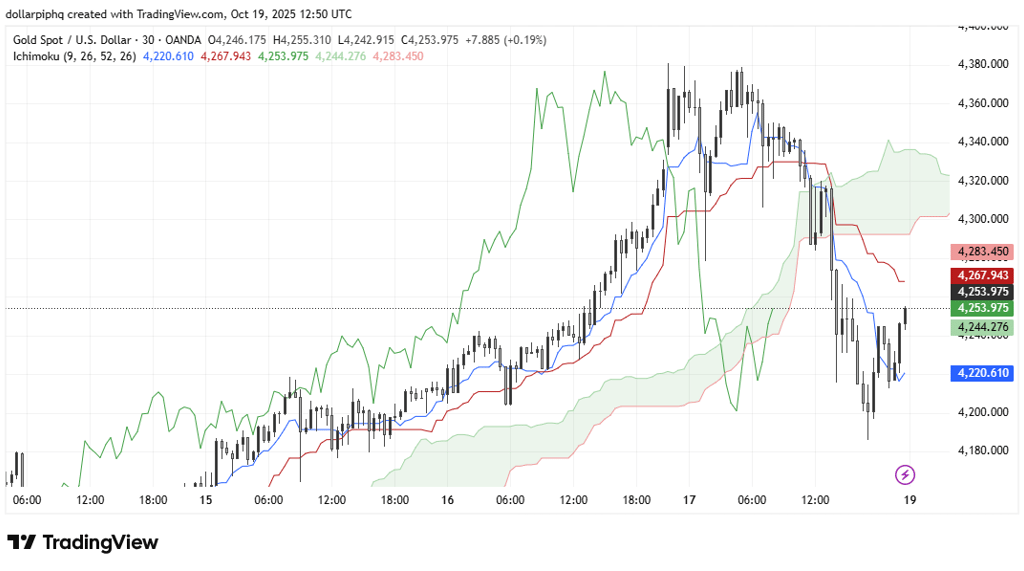
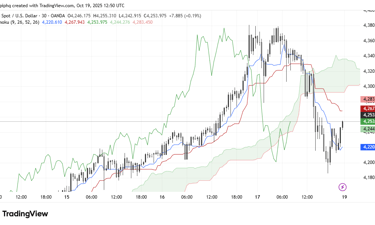
The Ichimoku Cloud, or Ichimoku Kinko Hyo, is a powerful all-in-one indicator that shows trend direction, momentum, and support/resistance levels.
The shaded area (Kumo) acts as a visual cloud to help identify potential reversals and strong trends at a glance.
Trend indicators are essential for traders who want to follow the market instead of fighting it. No single indicator is perfect — but combining trend indicators with momentum, volume, and volatility tools gives a clearer and more confident trading view.
Stay consistent, keep analyzing, and remember — the trend is your friend.