

TYPES OF MOMENTUM INDICATOR IN TRADING
Discover the types of momentum indicators used by traders to measure price speed, strength, and potential reversals in the forex market
MOMENTUM INDICATOR
Dollarpip
2 min read

1. Relative Strength Index (RSI)
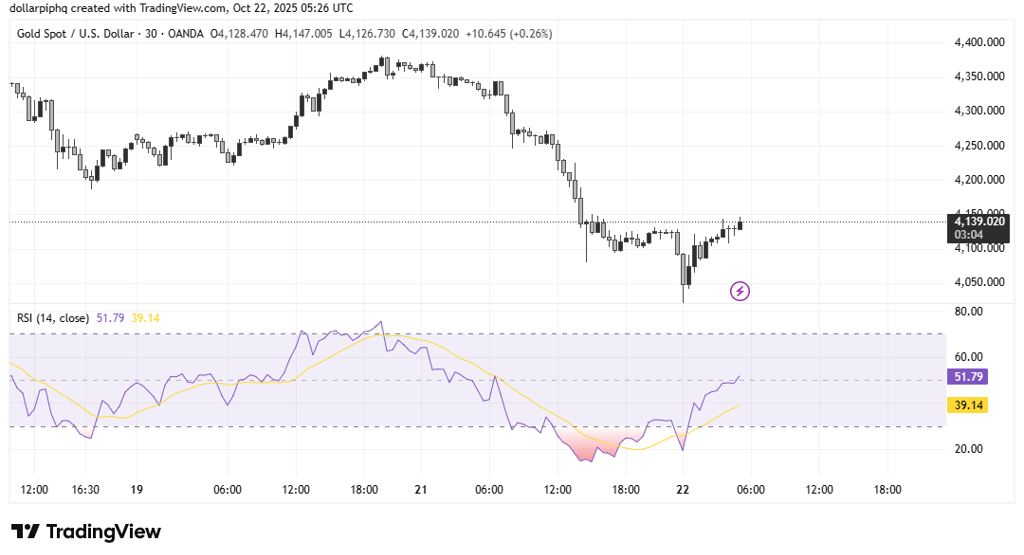
The RSI helps identify whether the market is overbought or oversold by oscillating between 0 and 100. When RSI is above 70, the market may be overbought and due for a pullback. When RSI is below 30, it could be oversold and ready to reverse upwards.
Example: On XAUUSD, if RSI drops below 30 and price forms a bullish candle, traders may look for a potential buy setup.
A momentum indicator is a technical analysis tool used to measure the speed or strength of price movement. Instead of focusing on trend direction, momentum indicators show how fast the market is moving — helping traders identify overbought, oversold, or reversal zones.
These tools are especially useful in fast-moving markets like XAUUSD (Gold), where price swings can happen quickly and timing is crucial.
2. Moving Average Convergence Divergence (MACD)
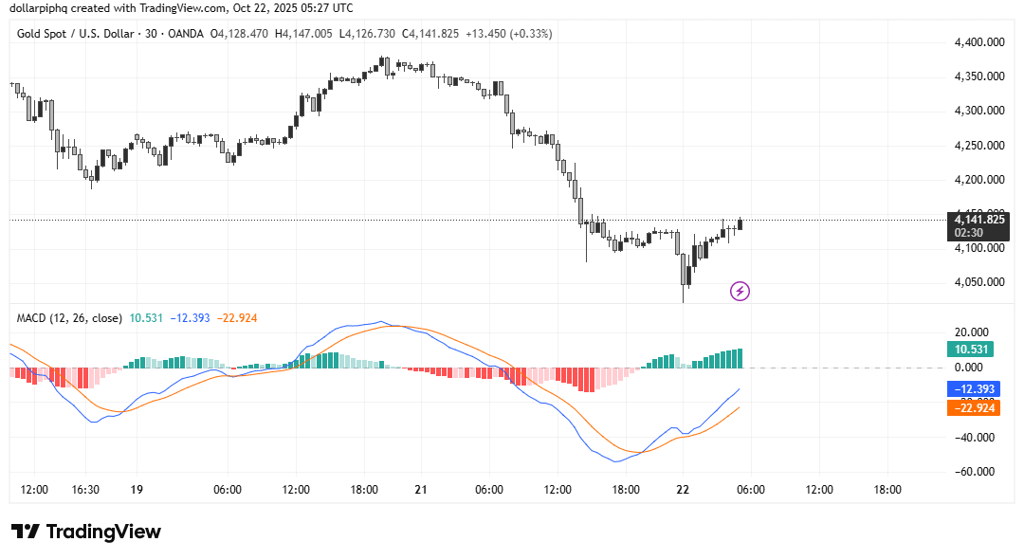
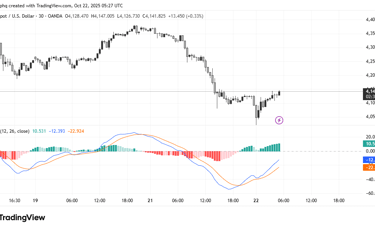
The MACD measures momentum strength by comparing two moving averages of price. It includes two lines and a histogram that show momentum changes. When the MACD line crosses above the signal line, momentum is turning bullish. When it crosses below, momentum is turning bearish.
Example: If XAUUSD MACD histogram shifts from red to green, it can be an early sign that buying pressure is increasing.
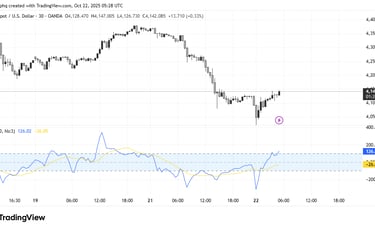
3. Stochastic Oscillator
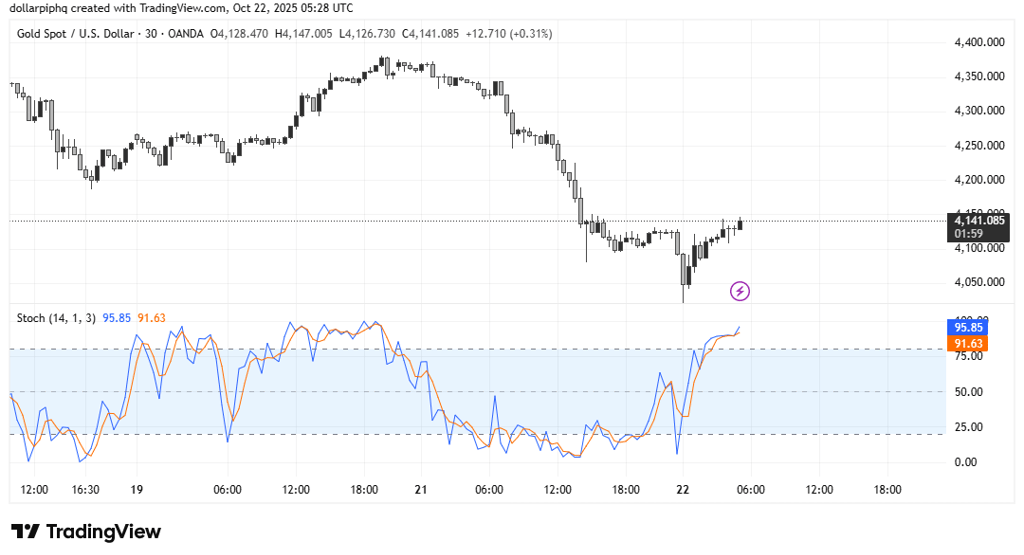
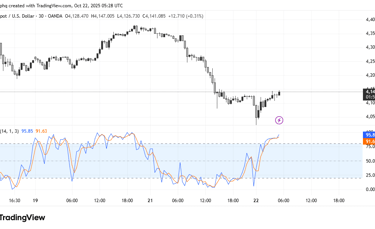
The Stochastic Oscillator compares the current closing price to its range over a set period, showing how strong recent momentum is. Readings above 80 = overbought. Readings below 20 = oversold.
Example: When XAUUSD Stochastic crosses down from 80, traders may anticipate a short-term correction.
4. Commodity Channel Index (CCI)
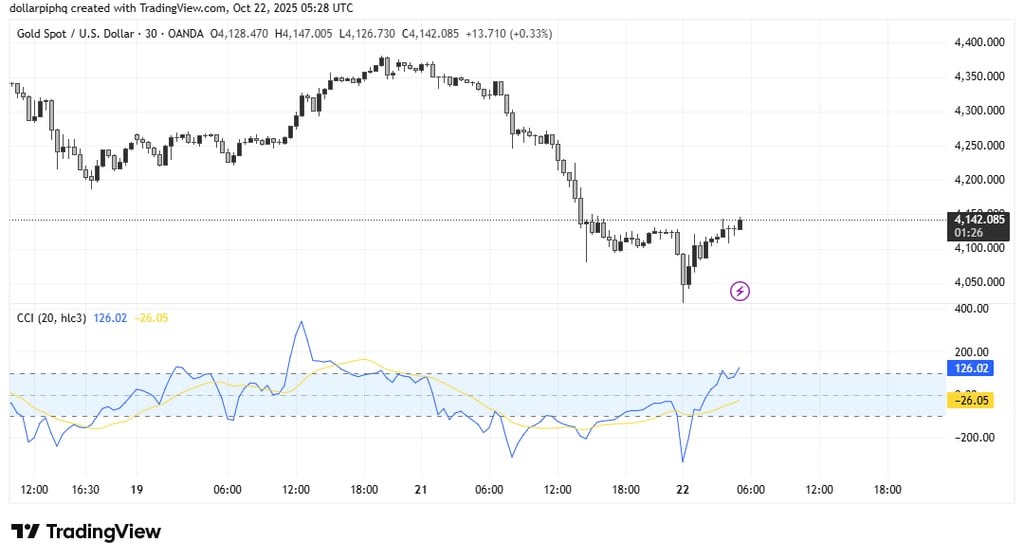
The CCI measures how far the price deviates from its average level. Values above +100 suggest strong bullish momentum. Values below -100 suggest strong bearish momentum.
Example: If XAUUSD breaks resistance with CCI above +100, it can confirm strong buying momentum.
Momentum indicators help traders understand the strength behind a price move — showing whether a trend has energy to continue or is about to slow down.
By combining these indicators with trend analysis and price action, traders can make more confident trading decisions and avoid false signals.